
TABLE OF CONTENTS
Introduction
Due to the nature of distributing surveys through Qualtrics LTI, Qualtrics itself does not know how many distributions there are for a given survey. On top of that, responses to the survey may not always contain user data that would allow, for example, duplicate responses to be filtered out during data analysis on the Qualtrics side. These facts can make it tricky to calculate the response rate of a survey.
The Response Rate feature, if enabled, adds a Response rate page to the Institute level of Qualtrics LTI. This page allows you to select a Survey and 1 or more Courses in order to calculate how many student Submissions and Distributions there are for a Qualtrics survey. More on the precise terminology below.
✏️ Note

If you want sub-account admins to also be able to use this feature, it is also possible to enable this page on Department levels by navigating to <Institute level> → Admin Settings → Enable the use of the 'Response rate' page on sub-accounts.

Even though the Response rate page is available in Qualtrics LTI in many (sub-)accounts, we request all course and submission data through Canvas using Canvas' permissions and authorisation system. This means that you will always see a list of courses that your user account has permissions to see, regardless of whether you are on the Institute level or Department level, and Canvas will also check your permissions for any assignments and courses that you request submission data from. To that end, you can consider the Response rate pages to exist separately to the account that you're viewing them on. They are not scoped to that particular account in any way.
Prerequisites
✏️ Note: The Response Rate feature is in Beta and is not available to all customers at this time. If you are interested in beta testing the feature, feel free to get in touch!
In order for the Response Rate feature to work, the following settings are required.
Canvas API Key: Allow Include Parameters
If you use a custom API Key for Qualtrics LTI and it has Enforce Scopes enabled, then it must also have Allow Include Parameters enabled.
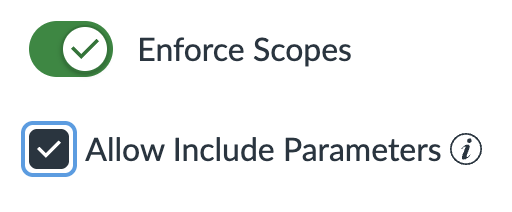
Fig 1. A screenshot of Canvas → Admin → <Root account> → Developer Keys → <API Key> → Enforce Scopes, with checkbox Allow Include Parameters checked.
This allows us to fetch the assignment and user data associated with each submission record. Without this, we cannot calculate the response rate.
Additionally, the following scope needs to be enabled:
url:GET|/api/v1/courses/:course_id/assignments/:assignment_id/submissions
✏️ Note: If you use our Inherited Key ("Qualtrics by Drieam"), then you do not need to do anything.
Survey: Grade Passback Settings
All data that we use to calculate the response rate comes from Canvas. We gather the submission records of assignments as the base scope of the data.
There are two scenarios you should consider when using the response rate feature:
- The attached survey instance has the With Canvas submission grade passback setting.
- The attached survey instance has the No Canvas submission grade passback setting.
The assignments that you want to gather the response rates for must be attached to a survey instance that has one of the With Canvas submission grade passback settings.
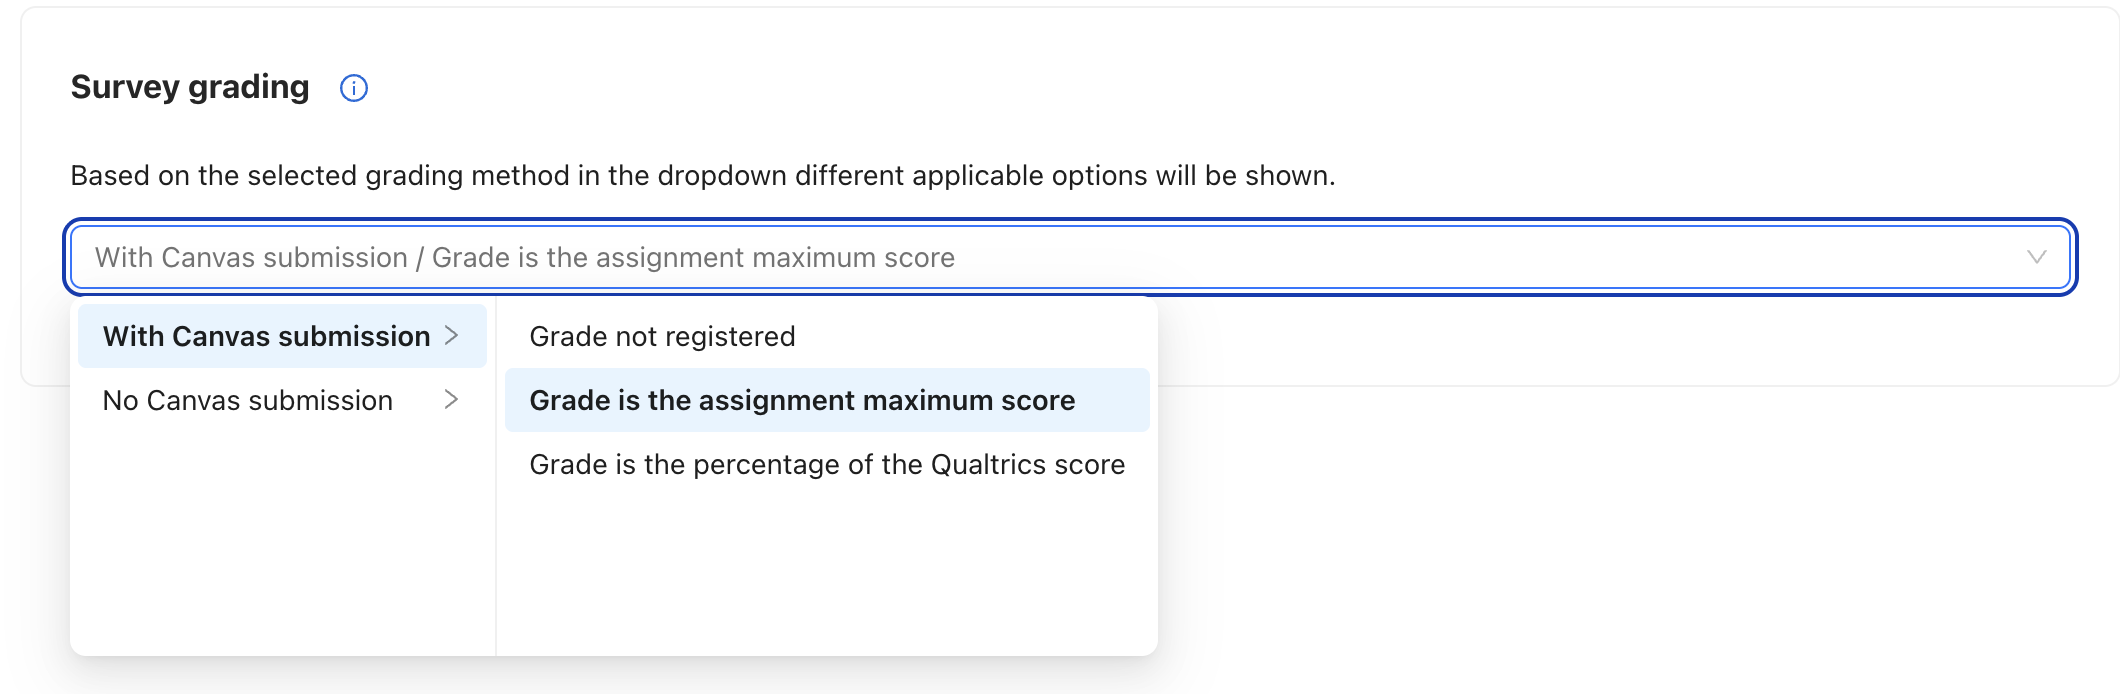
Fig 2. A screenshot of the Qualtrics LTI → <Survey> → Settings → Survey grading section, with With Canvas submission highlighted in a dropdown.
If a survey instance has the With Canvas submission setting, then when a student completes the survey in an assignment that that survey instance is attached to, Qualtrics LTI will update the corresponding submission record in Canvas to be 'submitted'. Likewise, if a survey instance has the No Canvas submission setting, then the corresponding submission record is not updated and it will fundamentally appear that the student has never submitted the assignment.
Our response rate feature works best in conjunction with "non-anonymous surveys" — those using the With Canvas submission setting. However, we also support "anonymous surveys" — those using the No Canvas submission setting — but the resulting calculation data may be less exhaustive.
Keep in mind that surveys can be added in multiple levels (multiple "survey instances"), each with different settings. For example, a survey can be added to the Institute level with With Canvas submission and a Department level with No Canvas submission. The response rate feature will attempt to calculate the response rate of the Qualtrics survey itself, across all levels where it was added to Qualtrics LTI.
Creating a Calculation
The New response rate calculation button on the Response rate page will open a form that allows you to select a Survey and 1 or more Courses. It also allows you to filter out certain submissions with Submitted from/until dates.
 Fig 3. A screenshot of the Qualtrics LTI → Response rate → New response rate calculation form. Shown is a pre-filled form with Survey selection, Course selection, and Submission filters as headers.
The Survey list shows the names of all Qualtrics surveys across the Institute level and all Department levels that you use. If a Qualtrics survey has exclusively been added to users' Personal Surveys areas, then this list will not include those surveys. This is for confidentiality reasons.
The Include responses for survey instances with 'No Canvas submission' checkbox allows you to choose whether or not we will attempt to factor in such survey instances into the calculation. See § Calculation Breakdown for a more detailed explanation.
The Course selection tree shows the names and course codes of all Canvas courses that Qualtrics LTI is aware of for your institution — in other words, all courses that have at least 1 assignment with a survey attached via Qualtrics LTI.
The Submitted from/until date fields allow you to exclude submissions that are not made between your chosen dates:
- If you leave Submitted from blank, then we will include all submissions up to and including the Submitted until date.
- If you leave Submitted until blank, then we will include all submissions made after your chosen Submitted from date.
- If you leave both blank, then we will simply include all submissions ever made.
Calculation Breakdown
After clicking the Calculate button, a precise sequence of steps occurs in order to gather and process the data required to calculate the response rate of your chosen Qualtrics survey.
 Fig 4. A screenshot of the Qualtrics LTI → Response rate → Overview section. Shown is the overview of a response rate calculation, showing a 7.14% response rate for 2 survey instances for 14 distributions.
We want you to know exactly how this data is processed so that you can make informed decisions with the information we provide. Therefore, we show you a breakdown of how the response rate was calculated, which will be specific to your configuration settings for the most recent calculation.
The following sections present a more fleshed-out and technical version of the calculation breakdown which is seen on the Response rate page.
Glossary
The terminology that we use throughout the response rate process is very specific and is hereby described so as to avoid confusion with terminology used by Canvas or Qualtrics.
Assignment record
This is a record that Qualtrics LTI has in its database. Whenever an Canvas assignment is created and is linked to a Qualtrics survey via Qualtrics LTI, we create an assignment record in our database, creating a link between the survey that was attached to the assignment and the course that the survey was distributed in.
When calculating the response rate, we only factor in responses to assignments that have corresponding assignment records in our database.
⚠️ Warning

An assignment record is only automatically created in the following scenarios:

1. The assignment was created through Canvas -> Create assignment -> External Tool (the 'Manual distribution' flow).
2. The assignment was created through Qualtrics LTI -> Bulk surveys -> + Add bulk survey (the 'Bulk distribution' flow).

If an assignment was copied or created through some other mechanism, then an assignment record is only created once the assignment has been opened. This means that copied assignments' submissions and/or associated survey responses won't be factored into the response rate calculation unless they have been opened once.
✏️ Note: When you revert a bulk, our associated assignment records will be deleted, too, and thus you won't be able to calculate a response rate for those assignments. We plan on adjusting this behaviour in the future.
Submission record
You can think of this as a combination of 'student + assignment'. Whenever an assignment is created in Canvas and assigned to students, Canvas creates a submission record for each of these students. By default, the submitted_at property of these records is null and the workflow_state is "unsubmitted" — in other words, it has a "default status of 'incomplete'". See Canvas' documentation for the Submissions API for more information.
If you create 2 assignments in a course with 3 students, and 1 assignment in a course with 5 students, then there are (2*3) + (1*5) = 11 submission records, ergo 11 distributions.
Submission
Confusingly, Canvas refers to submission records as "Submissions", even if they haven't actually been submitted. When we refer to submissions in Qualtrics LTI, we are referring to submission records that have the workflow_state of either: "submitted", "graded", or "pending_review".
If the Include responses for survey instances with 'No Canvas submission' setting was enabled for this calculation, then we the workflow_state will not be any of the above, and we will attempt to find a matching response record in our database. If that is successful, then we also consider that submission record to be a submission.
Distribution
For regular Qualtrics surveys, Qualtrics refers to the number of contacts that the survey has been distributed to as the number of 'Distributions'. For many types of surveys, including those distributed via Qualtrics LTI, Qualtrics cannot know this number as it does not have access to that population data, e.g. the number of students + assignments in Canvas.
To that end, the Distribution count is equal to the number of all submission records from Canvas for your chosen survey's assignments.
Steps
These are the steps taken by Qualtrics LTI to retrieve and process the data from Canvas:
- We find all assignment records in our database that are associated with your selected survey and any of the selected courses.
- We fetch all submission records from Canvas for those courses, including associated assignment and user data.
- We do this using the List assignment submissions endpoint.
- The amount of time that the response rate calculation takes is thus directly proportionate to the number of submission records that exist in your selected courses for each of the assignment records.
- We filter out the submission records that:
- are for an assignment that is currently unpublished, regardless of whether it was once published;
- have an associated User object with a name resembling "Test Student";
- This is the student that you impersonate when you use the View as student feature in Canvas.
- have a submitted_at date that does not fall between your chosen Submitted from/until dates;
- do not have an associated Assignment object with an external_tool_tag_attributes['url'] value that is associated with the survey you selected in your configuration.
- E.g. if a submission record has an associated Assignment object with external_tool_tag_attributes['url']: "https://qualtrics.drieam.com/lti/launches?assignment_id=bfadc59a-0aac-449d-ad89-47b37ccfaabc", we check if the assignment record in our database associated with that ID was created for an instance of the survey that you selected.
- For each remaining submission record, we determine whether or not the user has responded:
- If the submission record has an external_tool_url of Qualtrics LTI, we:
- check if the workflow_state of the submission record is "submitted", "graded", or "pending_review":
- If it is one of the above, we internally mark that submission record as 'submitted'.
- If it is not, what we do depends on the Include survey instances with 'No Canvas submission' setting:
- If disabled, we internally mark that submission record as not being submitted.
- If enabled, we attempt to find a user record in our database that matches the submission record's user:
- If we found a user, we internally mark the submission as 'submitted' if there is a corresponding response record in our database, or 'unsubmitted' if not.
- If we did not find a user, we internally mark the submission as 'unsubmitted and uncertain'.
- internally mark that submission record as 'submitted'.
- check if the workflow_state of the submission record is "submitted", "graded", or "pending_review":
- If the submission record does not have an external_tool_url, or does but it is not of Qualtrics LTI, we internally mark that submission record as 'unsubmitted' (as we cannot guarantee whether or not they responded).
- In principle, this should never occur. It is a defensive measure.
- In principle, this should never occur. It is a defensive measure.
- If the submission record has an external_tool_url of Qualtrics LTI, we:
- We group each submission record by assignment and establish the response rate for that assignment:
- We add up all submission records that we marked as 'submitted' to form the Submissions number of that assignment.
- We count the number of total submission records for that assignment to form the Distributions number.
- We divide Submissions over Distributions to form the percentage for that assignment.
- We further group each assignment's set of submission records by the course that the assignment(s) are under:
- We add up the Submissions number of each assignment to form the Submissions number of the course.
- We add up the Distributions number of each assignment to form the Distributions number of the course.
- We divide Submissions over Distributions to form the percentage for that course.
- We establish the response rate for the survey as a whole:
- We add up the Submissions number of each course to form the Submissions number for the survey.
- We add up the Distributions number of each course to form the Distributions number of the survey.
- We divide Submissions over Distributions to form the percentage for the survey.
- We render a breakdown of the response rate by survey, course, and assignments on the Response rate page.
Examples
Scenario 1: Non-anonymous surveys
- You have a Qualtrics survey, "Course evaluation".
- You have added this to the Institute level ("University of Drieam") and 1 other Department level ("Department of Comp. Sci.").
- For both survey instances, the grade passback setting is With Canvas submission.
- You have distributed this into 5 Canvas courses.
- Each of those courses has exactly 10 students.
- In 4 courses, all 10 students completed the survey. In 1 course, 5 students did not.
In the New response rate calculation form, you select the Survey "Course evaluation" and select all courses in the Course selection list.
After clicking Calculate, we find the assignments in our database and fetch 50 submission records from Canvas, 45 of which have the workflow_state of "submitted".
We determine there to be 50 Distributions and 45 Submissions, and organise that per course and assignment, before rendering it on the page in Qualtrics LTI.
Scenario 2: Anonymous surveys
- You have a Qualtrics survey, "Course evaluation".
- You have added this to the Institute level ("University of Drieam") and 1 other Department level ("Department of Comp. Sci.").
- For both survey instances, the grade passback setting is No Canvas submission.
- You have distributed this into 5 Canvas courses.
- Each of those courses has exactly 10 students.
- In one of the courses, 5 of the students do not have a corresponding record in our database.
- All 50 students have completed the survey.
In the New response rate calculation form, you select the Survey "Course evaluation", enable the Include responses for survey instances with 'No Canvas submission' setting, and select all courses in the Course selection list.
After clicking Calculate, we find the assignments in our database and fetch 50 submission records from Canvas, all of which have the workflow_state of "unsubmitted". For 45 of the submission records, we find the corresponding user and a matching response record in our database. For the remaining 5 submission records, we are unable to determine the user in our database, and thus cannot find any matching response records.
We determine there to be 50 Distributions and 45 Submissions, and organise that per course and assignment, before rendering it on the page in Qualtrics LTI.
Scenario 3: Mixed anonymity
- You have a Qualtrics survey, "Course evaluation".
- You have added this to the Institute level ("University of Drieam") and 1 other Department level ("Department of Comp. Sci.").
- For the Institute-level survey instance, the grade passback setting is With Canvas submission.
- For the Department-level survey instance, the grade passback setting is No Canvas submission.
- You have distributed the Institute-level survey instance into 4 Canvas courses.
- You have distributed the Department-level survey instance into 1 Canvas course.
- Each of those courses has exactly 10 students.
- In the Department-level course, 5 of the students do not have a corresponding record in our database.
- All 50 students have completed the survey.
In the New response rate calculation form, you select the Survey "Course evaluation", enable the Include responses for survey instances with 'No Canvas submission' setting, and select all courses in the Course selection list.
After clicking Calculate, we find the assignments in our database and fetch 40 submission records from Canvas, all of which have the workflow_state of "submitted", and 10 submission records, all of which have the workflow_state of "unsubmitted". For 5 of the "unsubmitted" submission records, we find the corresponding user and a matching response record in our database. For the remaining 5 submission records, we are unable to determine the user in our database, and thus cannot find any matching response records.
We determine there to be 50 Distributions and 45 Submissions, and organise that per course and assignment, before rendering it on the page in Qualtrics LTI.
Was this article helpful?
That’s Great!
Thank you for your feedback
Sorry! We couldn't be helpful
Thank you for your feedback
Feedback sent
We appreciate your effort and will try to fix the article